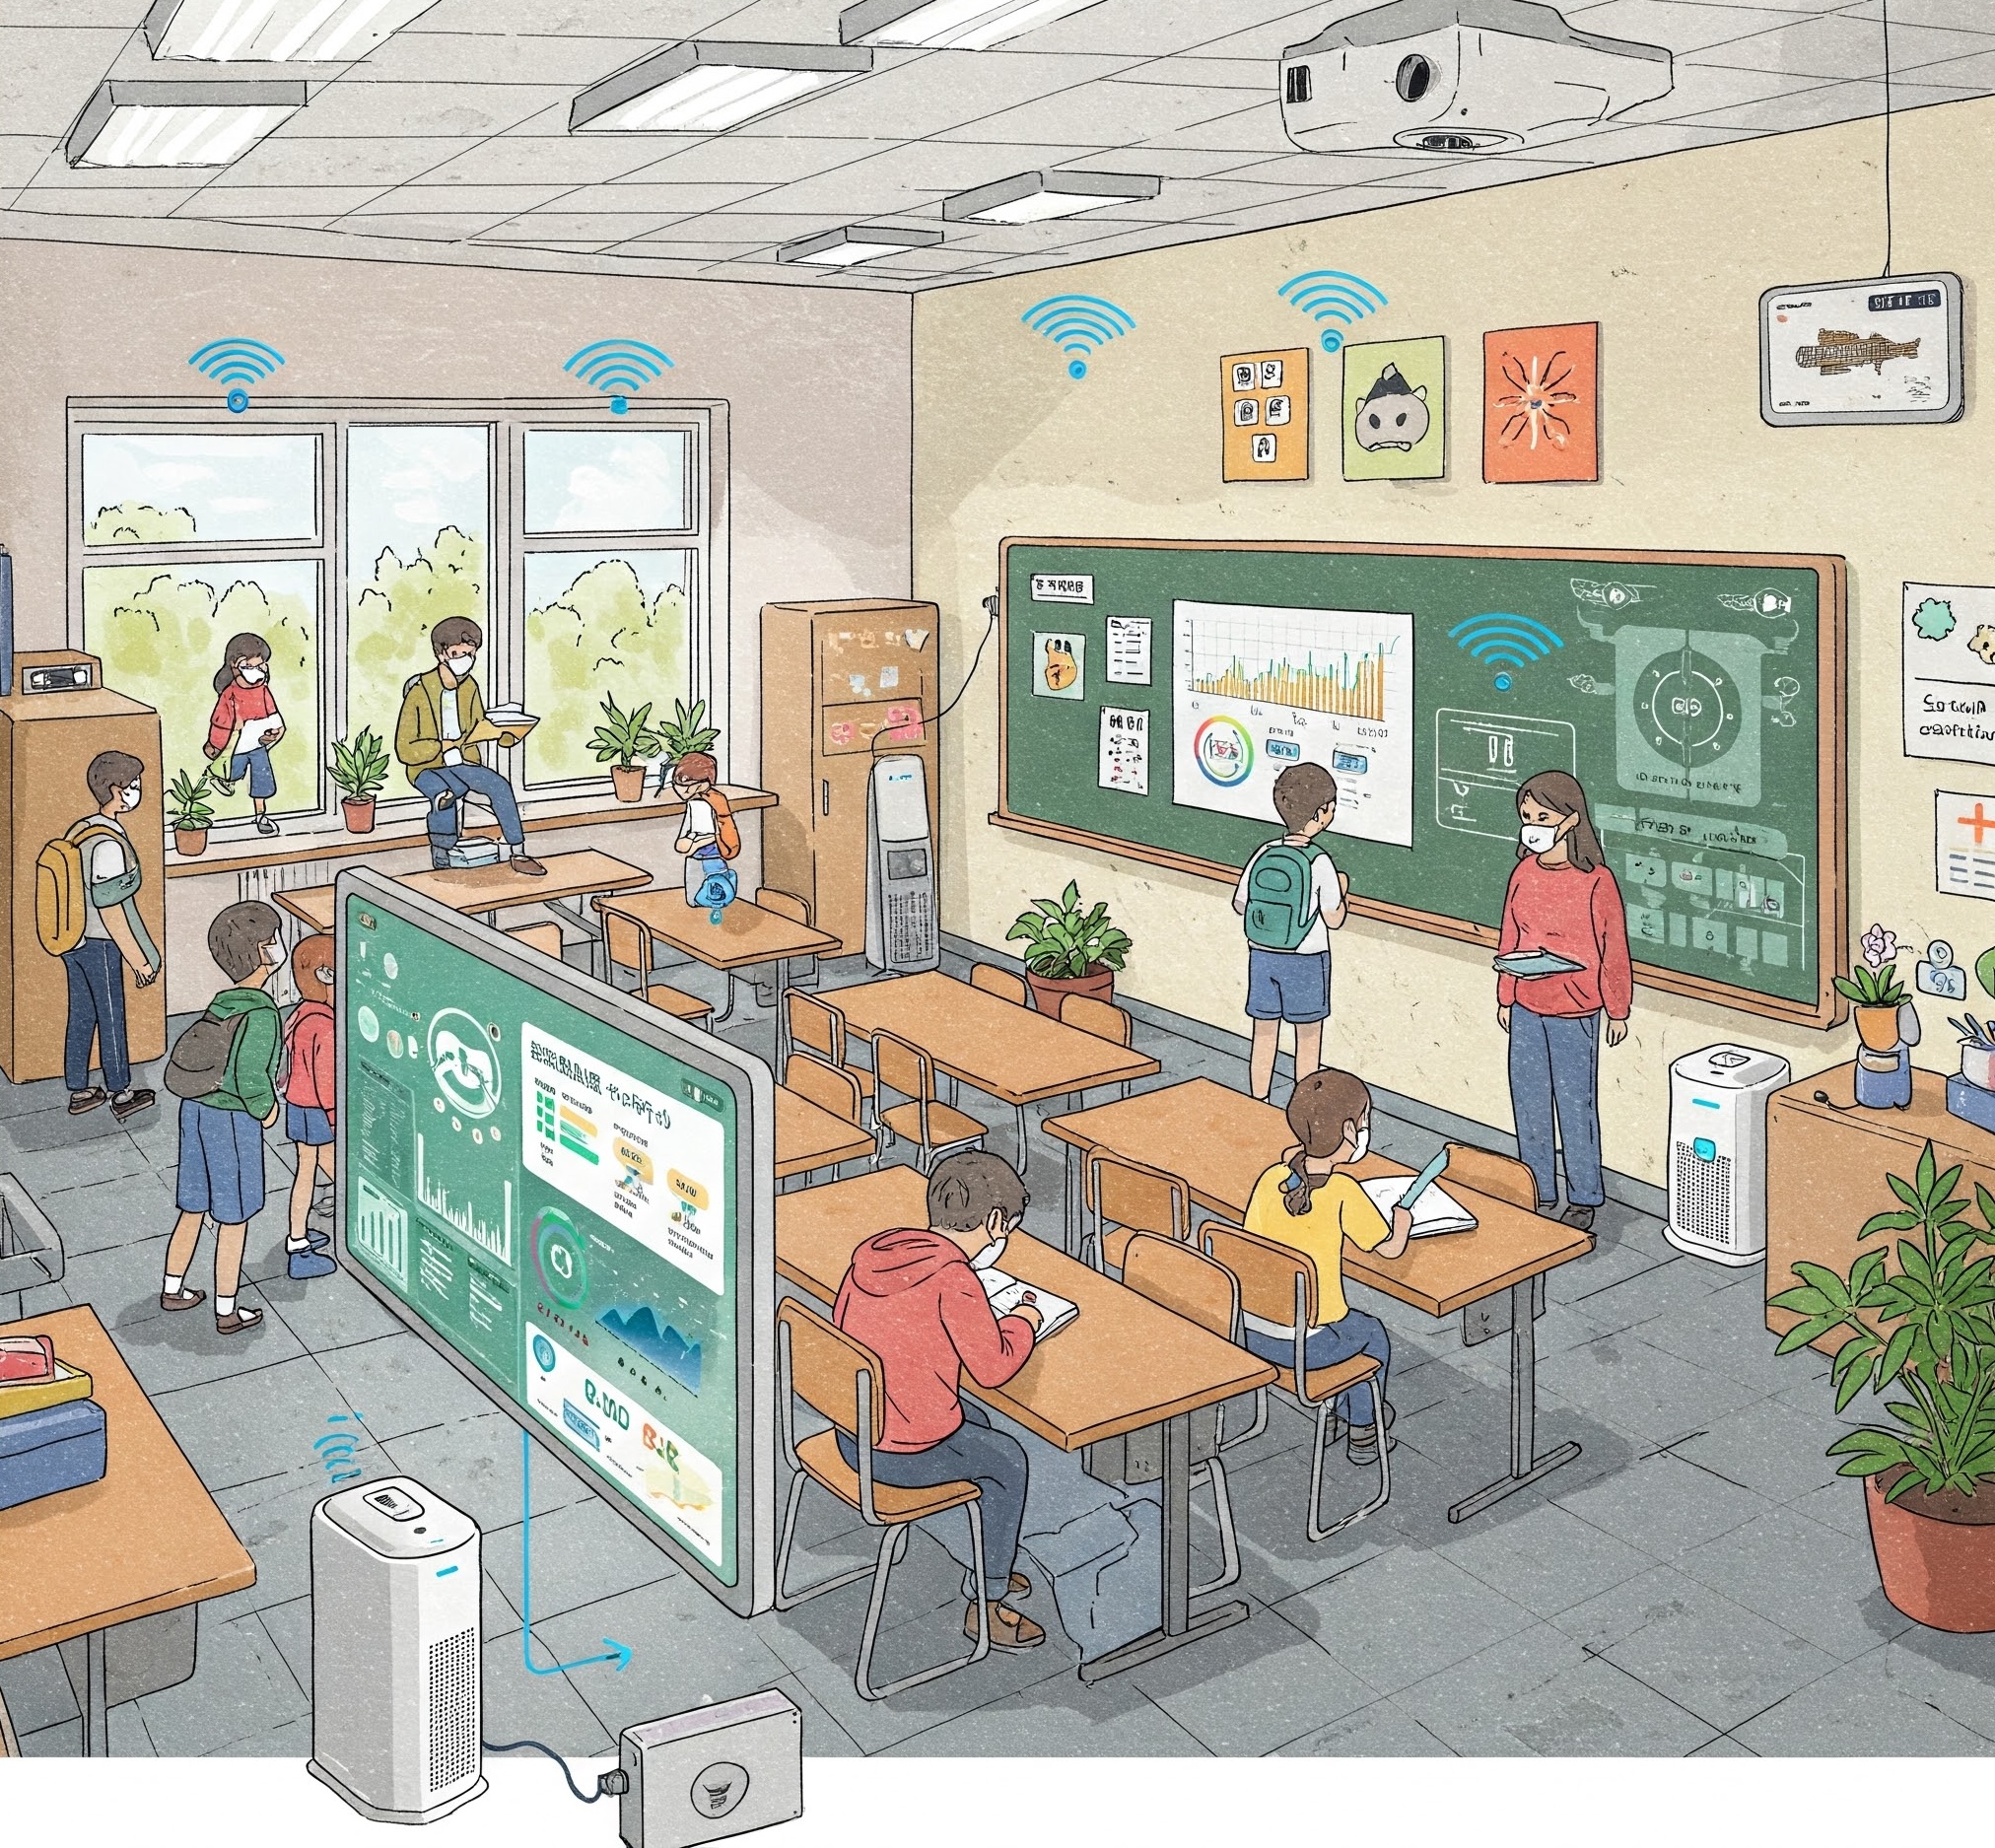
Interactive Demo
An interactive snapshot of the Airlume dashboard. Click around the rooms, alerts, and floor map to explore how the product surfaces air-quality data. This is a self-contained demo running on sample data.
Project Overview
Air quality is a foundational health condition for learning environments. In schools, poor indoor air quality can intensify asthma and allergy symptoms, increase absenteeism, and negatively affect classroom performance.
Airlume explores a practical response: combine monitoring hardware, filtration systems, and a decision-support dashboard so schools can detect issues earlier and respond with evidence-based actions.
Target Problems
The project centers on preventable respiratory burden in school-age populations and its downstream impact on education outcomes.
1.8M+
Emergency Visits
14M
Missed School Days
3,517
Annual Deaths
Impact on Schools
Poor air quality contributes to missed class time, lower academic performance, and disproportionate operational stress in under-resourced districts where absenteeism already carries substantial educational and financial consequences.
Current Solution
Airlume combines three primary intervention layers to improve indoor air quality management and make outcomes measurable over time.
HVAC Monitoring Sensors
Advanced sensors continuously track indoor air quality metrics across school environments for real-time visibility and faster intervention.
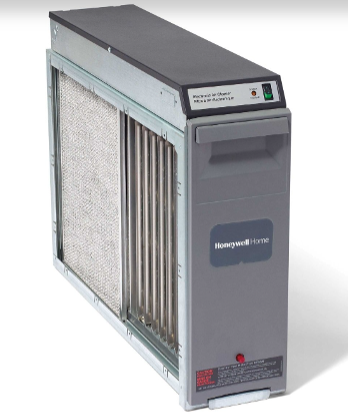
Advanced Air Filters
High-efficiency filtration systems reduce particulate exposure and improve breathing conditions for students and staff.
SteraMist Technology
An additional disinfection layer designed to neutralize airborne microorganisms that traditional filtering may not fully address.

Data Processing Pipeline
The program uses a simple end-to-end data pipeline that connects sensor deployment to actionable reporting.
Installation
Sensors are deployed in hallways, classrooms, and shared spaces.
Extraction
Data is collected through Ethernet, Wi-Fi, and cellular or Bluetooth channels.
Storage
Collected readings are aggregated into cloud or data-lake infrastructure.
Display
Data is organized and surfaced in a dashboard for school administrators and operational teams.
Data Visualization
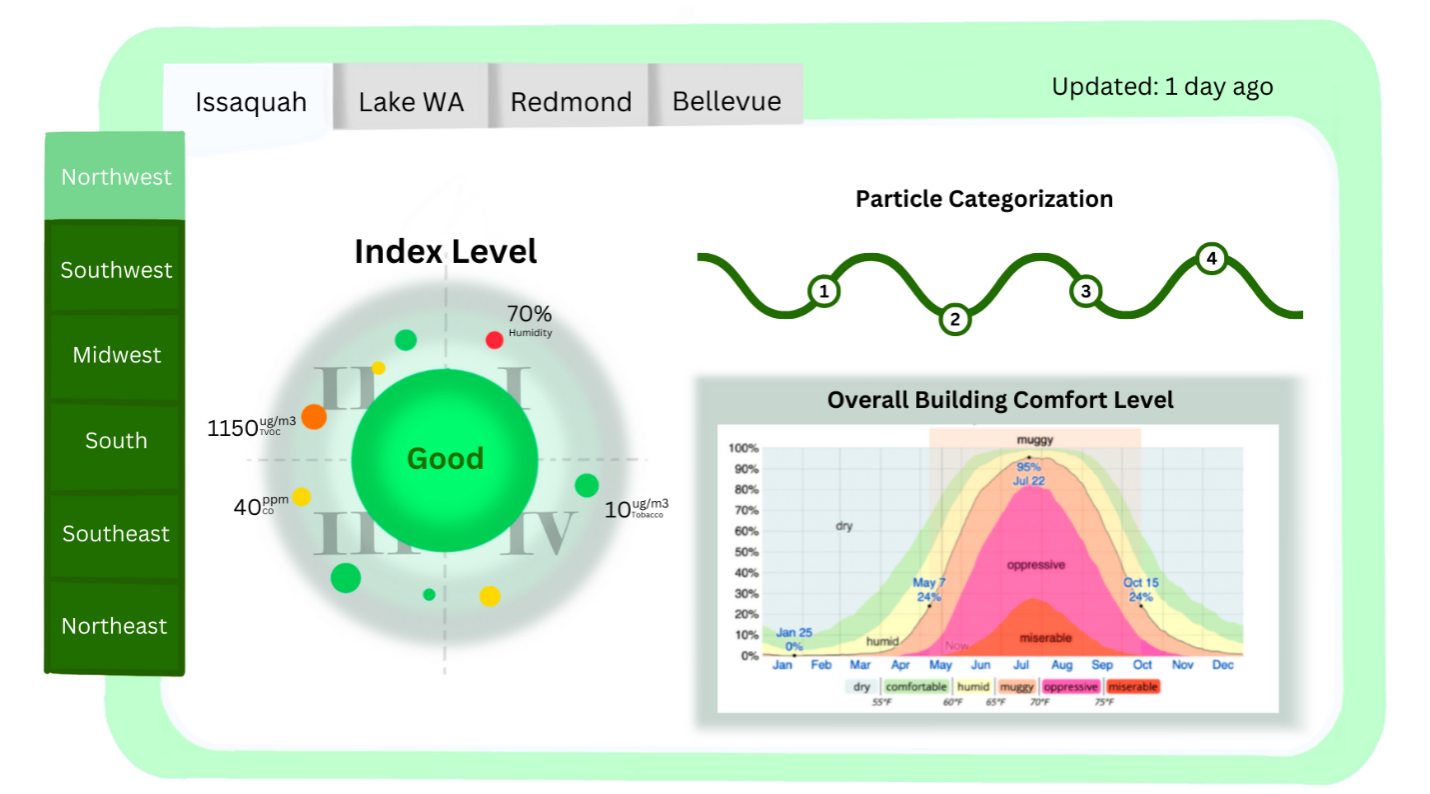
The Airlume dashboard is designed to make technical air-quality data interpretable for school stakeholders who need rapid situational awareness and clear intervention signals.
Index Level Interactive Scale
Color-coded pollutant levels communicate health status at a glance.
Overall Building Comfort Level Graph
Trend analysis helps teams identify recurring air quality patterns across the school year.
Particle Categorization Diagram
Detailed pollutant categories provide clearer context on exposure and risk.
Next Steps
The next phase focuses on tighter data integration, improved sensing quality, and stronger filtration automation pathways.
Dashboard Integration
Unify and upgrade data streams into a single interface for a more complete and actionable view.
NanoEnvi Sensors
Introduce additional sensor capability to improve pollutant detection precision and reliability.
Efficient Filtration
Refine automated filtration workflows with EAC and maintain SteraMist as a backup pathway.
This white paper frames Airlume as a practical school-health infrastructure model where environmental sensing, data systems, and operational response are treated as one integrated workflow.
More Research

Threat Landscape: Security Risks in Production Agentic AI Systems
June 13, 2026

Architectural Patience: When Isolation Isn't an Outage
May 29, 2026

Mesh AI: Toward a Non-Linear Model of Human-Centered Intelligence
April 27, 2026